WELCOME to STATE of the ENVIRONMENT IN UKRAINE |
|
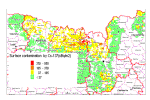
In consequence of the Chernobyl nuclear power plant catastrophe, 8.4 million hectares of agricultural land were contaminated, out of which 3.5 million hectares were tillage land, nearly 400,000 hectares were natural pasturelands, and more than 3 million hectares were forest. This was the major reason for the abandoning of 180,000 hectares of arable land and 157,000 hectares of forest. The law permits agricultural activities to be conducted on land with a density of contamination by 137Cs running as high as 555 kBq/m² (15 Ki/km²). In 1998 the maximum level of density of contamination by 137Cs did not exceed 363 kBq/m² (~10 Ki/km²). During 1997-1998 a process of self-decontamination of the upper layers of the soil was under way, however, its pace was insignificant. Horizontal migration of radioactive nuclei did not produce considerable redistribution within the arable layers of the soil. Spectrophotometric analysis data show a vertical migration of 137Cs along the soil profile. Intensive migration of 137Cs takes place in the more loose humus (arable) layer of the soil. The general trend in the radioactive cesium redistribution within the soil profile of the peat soil is a gradual widening of the radioactive nucleus layer in the soil. In 1998 (12 years after the Chernobyl catastrophe) radioactive cesium was spread over the soil profile to a depth of 1 m, though in insignificant quantities (1-2.2%). Judging by the dynamics of the 137/134 Cs distribution within the profile of the turf-podzol sand loam soil in the course of time, one can notice that in the layer of 0-10 cm the density of contamination is declining from 46% to 39% of the total radioactive cesium mass. In general, the analysis gives a similar picture of the cesium distribution along the vertical layers. The layer of 0-20 cm shows an equal distribution of the element: in average it comprises 41% of the contaminating particles, the layer of 20-40 cm accumulates a minimum of 7% of the particles, and the depth of 100 cm again has an equal distribution of the radioactive cesium. In consequence of the Chernobyl nuclear power plant catastrophe, 8.4 million hectares of agricultural land were contaminated, out of which 3.5 million hectares were tillage land, nearly 400,000 hectares were natural pasturelands, and more than 3 million hectares were forest. This was the major reason for the abandoning of 180,000 hectares of arable land and 157,000 hectares of forest. The law permits agricultural activities to be conducted on land with a density of contamination by 137Cs running as high as 555 kBq/m² (15 Ki/km²). In 1998 the maximum level of density of contamination by 137Cs did not exceed 363 kBq/m² (~10 Ki/km²). During 1997-1998 a process of self-decontamination of the upper layers of the soil was under way, however, its pace was insignificant. Horizontal migration of radioactive nuclei did not produce considerable redistribution within the arable layers of the soil. Spectrophotometric analysis data show a vertical migration of 137Cs along the soil profile. Intensive migration of 137Cs takes place in the more loose humus (arable) layer of the soil. The general trend in the radioactive cesium redistribution within the soil profile of the peat soil is a gradual widening of the radioactive nucleus layer in the soil. In 1998 (12 years after the Chernobyl catastrophe) radioactive cesium was spread over the soil profile to a depth of 1 m, though in insignificant quantities (1-2.2%). Judging by the dynamics of the 137/134 Cs distribution within the profile of the turf-podzol sand loam soil in the course of time, one can notice that in the layer of 0-10 cm the density of contamination is declining from 46% to 39% of the total radioactive cesium mass. In general, the analysis gives a similar picture of the cesium distribution along the vertical layers. The layer of 0-20 cm shows an equal distribution of the element: in average it comprises 41% of the contaminating particles, the layer of 20-40 cm accumulates a minimum of 7% of the particles, and the depth of 100 cm again has an equal distribution of the radioactive cesium. Figure depicts a map of soil contamination in five administrative regions as of 1998. To develop the map, data on the average soil contamination density of the land belonging to the regions’ collective agricultural enterprises were utilized. To develop the map, data on the average soil contamination density of the land belonging to the regions’ collective agricultural enterprises were utilized.
|