|
|
 |
 |
 |
 |
 |
Issues |
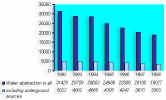 |
Fig.3.1 Dynamics
of water abstraction from surface and ground water systems (1992-1998) (1,000,000 mі) |
|
|
|
|
|
Water |
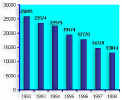 |
Fig.3.2
Consumption of water from water bodies (1,000,000 mі) |
|
|
|
|
|
Water |
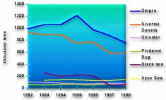 |
Fig.3.3 Dynamics
of contaminant substances discharge into Ukrainian rivers and seas (1992-1996) |
|
|
|
|
|
Water |
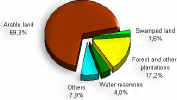 |
Fig.3.4 Structure of land
resources of Ukraine as of 1 January 1999(data from State Committee for Statistics of
Ukraine) |
|
|
|
|
|
Soil |
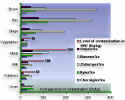 |
Fig.3.5 Average contamination of
agricultural crops by region (1998) |
|
|
|
|
|
Soil |
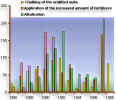 |
Fig.3.6 Dynamics of
counter-measures implemented on contaminated agricultural lands of Ukraine, thousand
hectares |
|
|
|
|
|
Soil |
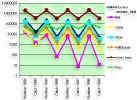 |
Fig.3.7 Dynamics of number and
catching of main species of hunting animals |
|
|
|
|
|
Fauna |
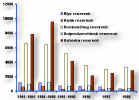 |
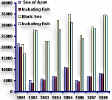
Fig.3.8 The Dynamic of Fish Catch
in Dnieper Cascade Reservoirs During 1981-1998 (tons) |
|
|
|
|
|
Fauna |
 <
/td> <
/td>
| Fig.3.9 Dynamics of harvesting of
fish and sea products from the Sea of Azov and the Black Sea by Ukraine in 1991-1998,
tons. |
|
|
|
|
|
Fishery |
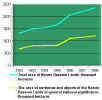 |
Fig.3.10 Changes in the area of
the Nature Reserve Lands during 1992-1998 |
|
|
|
|
|
Reserve Land |
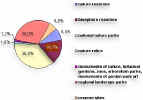 |
Fig.3.11 Structure of natural
reserves in Ukraine |
|
|
|
|
|
Reserve Land |
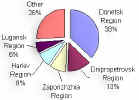 |
Fig.3.12 Allocation of ashes and
ash-slag waste formation in regions. |
|
|
|
|
|
Waste |
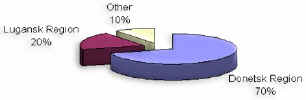 |
Fig.3.13 Allocation of coal mining
and coal concentrating waste formation in regions |
|
|
|
|
|
Waste |
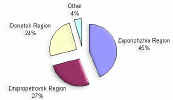 |
Fig.3.14 Allocation of
metallurgical slags formation in regions |
|
|
|
|
|
Waste |
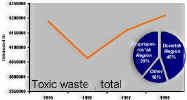 |
Fig.3.15 Dynamics of toxic waste
accumulation in Ukraine (thousand tn) and allocation of toxic waste accumulation in
regions (% of total amount |
|
|
|
|
|
Waste |
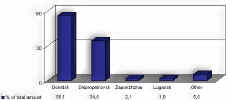 |
Fig.3.16 Allocation of 1st-4th
danger level toxic waste accumulation in regions. |
|
|
|
|
|
Waste |
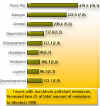 |
Fig 3.17 Towns
with maximum pollutant emissions, thousand tons (% of total amount of emissions in
Ukraine) 1998 |
|
|
|
|
|
Airs |
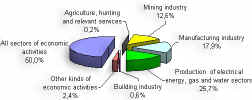 |
Fig.3.18
Emission dynamics of polluting substances from stationary sources by main sectors of
economic activities |
|
|
|
|
|
Airs |
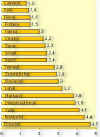 |
Fig.4.1 Annual average content of
benzapyrene in atmospheric air of Ukraine cities in 1998 multiple to maximum permissible
concentration |
|
|
|
|
|
Air |
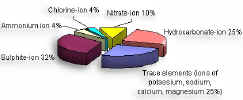 |
Fig.4.2 Weighted average content
of separate ions (%) in total mineralization of atmospheric precipitations in 1998 |
|
|
|
|
|
Air |
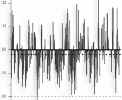 |
Fig.4.3 Deviation from climatic
norm of the total content of ozone |
|
|
|
|
|
Ozon Layer |
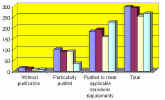 |
Fig.5.1 Volumes of waste water
discharge into the Black Sea |
|
|
|
|
|
Sea water |
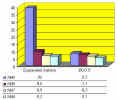 |
Fig.5.2 Pollutants discharge into
the Black Sea, thousand tons per year |
|
|
|
|
|
Sea water |
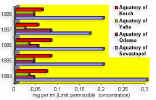 |
Fig.5.3 Petroleum
product content (mg/l) in sea water samples from the major regions of the Black Sea. |
|
|
|
|
|
Sea water |
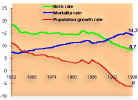 |
Fig.6.1 Birth
rate, death rate and population growth coefficients (per 1,000 people) |
|
|
|
|
|
Health |
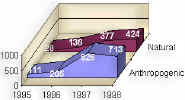 |
Fig.7.1 Dynamics of anthropogenic
and natural emergencies |
|
|
|
|
|
Ec.safety |
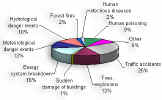 |
Fig.7.2 The distribution of
considerable state and national emergencies |
|
|
|
|
|
Ec.safety |
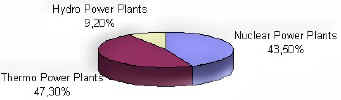 |
Fig.7.4 Electricity generation in
Ukraine in 1998 |
|
|
|
|
|
Power energy |
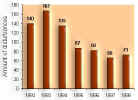 |
Fig.7.5
Disturbances at Ukrainian NPSs (1992-1998) |
|
|
|
|
|
Power energy |